Big Fire Causes Big Damage in Yakima Wednesday
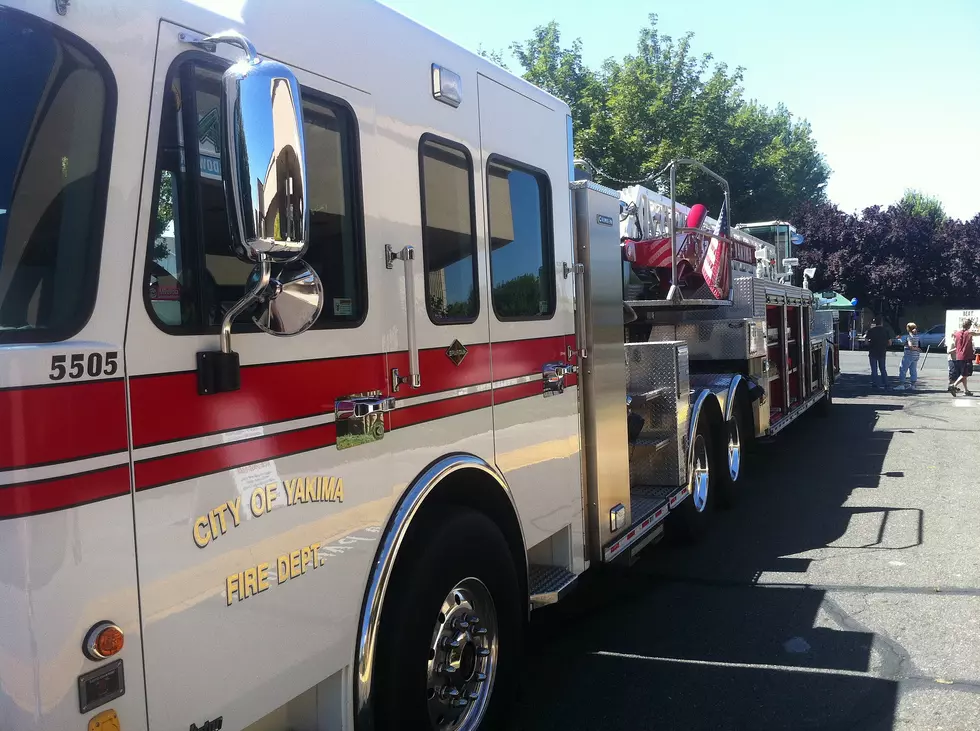
Yakima Fire Department Firefighters were busy with a house fire Wednesday morning that caused an estimated $350,000 in Damage.
Firefighters found a home fully on fire and the resident outside
Firefighters were called to the home in the 1300 block of Fairbanks Avenue at about 5:30 am Wednesday. They found a home fully engulfed in flames when they arrived. The one person in the home evacuated before firefighters arrived. No injuries were reported.
The home and everything inside were lost to the flames.
The cause remains under investigation. It was a lot of work to douse the flames. 22 firefighters worked for more than 2 hours to make sure the fire was out.
Although the cause remains under investigation, firefighters say they see a lot of fires at this time of year.
A lot of fires at this time of year are caused by heating devices
Typically at this time of year firefighters get busy with heating related fires. Many house fires during the fall months are started by baseboard and space heaters or heaters used to warm animals.
While space heaters do a lot of damage, cigarettes are the deadliest
But cigarettes do the most damage no matter what time of year. According to the Centers for Disease Control and Prevention the most recent information shows only 15.5% or less of the adult population are smokers compared with 33% in 1980. Despite the small number of people who are smoking, smoking remains the leading cause of home fire deaths.
LOOK: The most expensive weather and climate disasters in recent decades
LOOK: See how much gasoline cost the year you started driving
READ ON: See the States Where People Live the Longest
More From 92.9 The Bull


